Emissions from urban areas account for about a tenth of the global methane budget, according to a new analysis of satellite data published in the Proceedings of the National Academy of Sciences of the United States of America. And those emissions grew by about 10% from 2020 to 2023, despite cities’ pledges to slash them.
Methane is a potent greenhouse gas, and it’s shorter lived in the atmosphere than carbon dioxide. That means cutting methane emissions would have great benefits for the climate over the short term. Oil and gas operations and agriculture are major sources of methane, but so are cities and their infrastructure.
“Cities have started attempting to reduce their methane emissions, and we hope to be able to monitor this,” said Erica Whiting, a graduate student in climate and space science at the University of Michigan. Most efforts to account for urban methane emissions—from wastewater treatment plants, landfills, leaky natural gas infrastructure, and other sources—have relied on ground-based measurements and on inventories that estimate emissions on the basis of activities, said Whiting. Most of these studies have looked at a handful of cities, typically in North America and Europe.
In contrast, Whiting said her team’s study is one of the first to use satellite data to monitor urban methane emissions over time. Satellite monitoring offers long-term, often global, measurements and can provide a clearer picture of how mitigation efforts are developing.
Falling Short
A growing number of cities are aiming to reduce carbon emissions, and the new data show many of them are not on track.
A growing number of cities are aiming to reduce carbon emissions, and the new data show many of them are not on track. Whiting’s study included 92 cities around the world, including 51 members of a coalition called C40, which was founded in 2005. This 96-country coalition is working toward the goal of cutting greenhouse gas emissions by half by 2030, including a 34% decrease in methane emissions. These numbers are aligned with the goal of limiting global warming to 1.5°C over preindustrial levels.
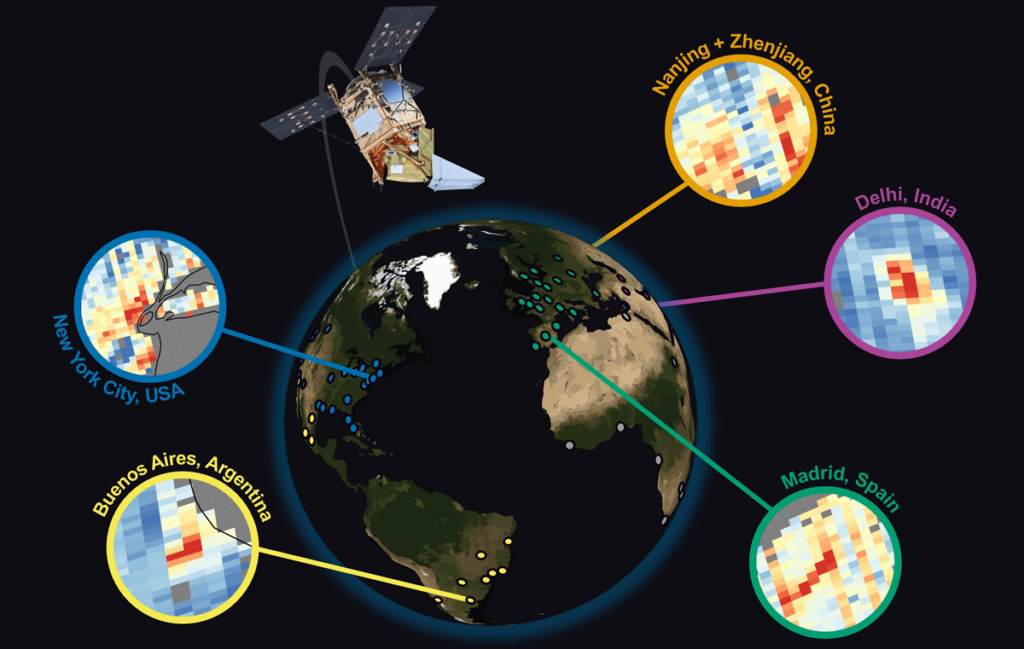
Whiting’s team analyzed methane data from the satellite-based TROPOMI (Tropospheric Monitoring Instrument) from 2019 to 2023. TROPOMI launched in 2017, making it possible to continuously monitor methane and other gas concentrations around the world. TROPOMI data showed that from 2019 to 2020, urban methane levels fell. But from 2020 to 2023, emissions grew 10% in C40 cities and 12% in non-C40 cities. The study focuses not just on urban centers but also on their outlying areas, where known methane sources such as landfills and wastewater treatment plants are often located.
The current study can’t point to what accounts for these trends, said Whiting. However, she said, urban populations grew during the study period, which could be a contributor to the cities’ growing emissions.
“In most regions of the world, there is no evidence that methane emissions from cities are decreasing at all.”
Rob Jackson, an Earth system scientist at Stanford University and chair of the Global Carbon Project, noted that it’s hard to know how to interpret the increase in emissions because the study period includes the era of the COVID-19 pandemic lockdowns, which caused major changes in people’s behavior and associated drops in anthropogenic emissions in 2020. (However, counterintuitively, the early 2020s actually saw a spike in overall methane emissions, which some scientists attribute to wetlands and changes in atmospheric chemistry.) Nevertheless, he said the data show that the world is not on track to decrease urban methane emissions. “In most regions of the world, there is no evidence that methane emissions from cities are decreasing at all,” he said.
“This work clearly shows that major cities worldwide are not reducing methane emissions at a rate consistent with the Global Methane Pledge,” Jackson said. This international agreement, made in 2021, has reduction goals that align with those of the C40 coalition: decrease global methane emissions by at least 30% relative to 2020 levels by 2030. The European Commission and 159 countries are participating in the pledge.
Whiting hopes better data will help. City and regional governments can use data from satellites to support and monitor ongoing efforts to lower methane emissions. “We’re excited to have this approach to monitor changes, and it should be useful for urban planning,” she said.
Zachary Tofias, director of food and waste at C40 Cities, noted via email that the organization was not involved with the design of the study. He pointed to several recent large-scale composting and other waste management facilities recently commissioned by member cities that should help bring down methane emissions going forward. The increasing availability of satellite and aerial monitoring data, he said, “provides an amazing additional tool for cities and facility managers to understand and address methane leaks from waste-disposal sites.”
—Katherine Bourzac (@bourzac.bsky.social), Science Writer
Citation: Bourzac, K. (2026), Urban methane emissions are rising, despite cities’ pledges, Eos, 107, https://doi.org/10.1029/2026EO260143. Published on 8 May 2026.
Text © 2026. The authors. CC BY-NC-ND 3.0
Except where otherwise noted, images are subject to copyright. Any reuse without express permission from the copyright owner is prohibited.