A very strong El Niño is close to its peak, and the November 19 winter maps from the Climate Prediction Center reflect its pull on this winter’s precipitation pattern. The agency’s November 12 ENSO discussion puts the chance of a strong to very strong event through January to March above 79 percent, with ocean temperatures in parts of the eastern equatorial Pacific running more than 4 degrees Celsius above normal. Forecasters expect the key Niño 3.4 reading to top 2.5 degrees between November and January and to fade through spring.
What NOAA’s Updated Winter Map Shows
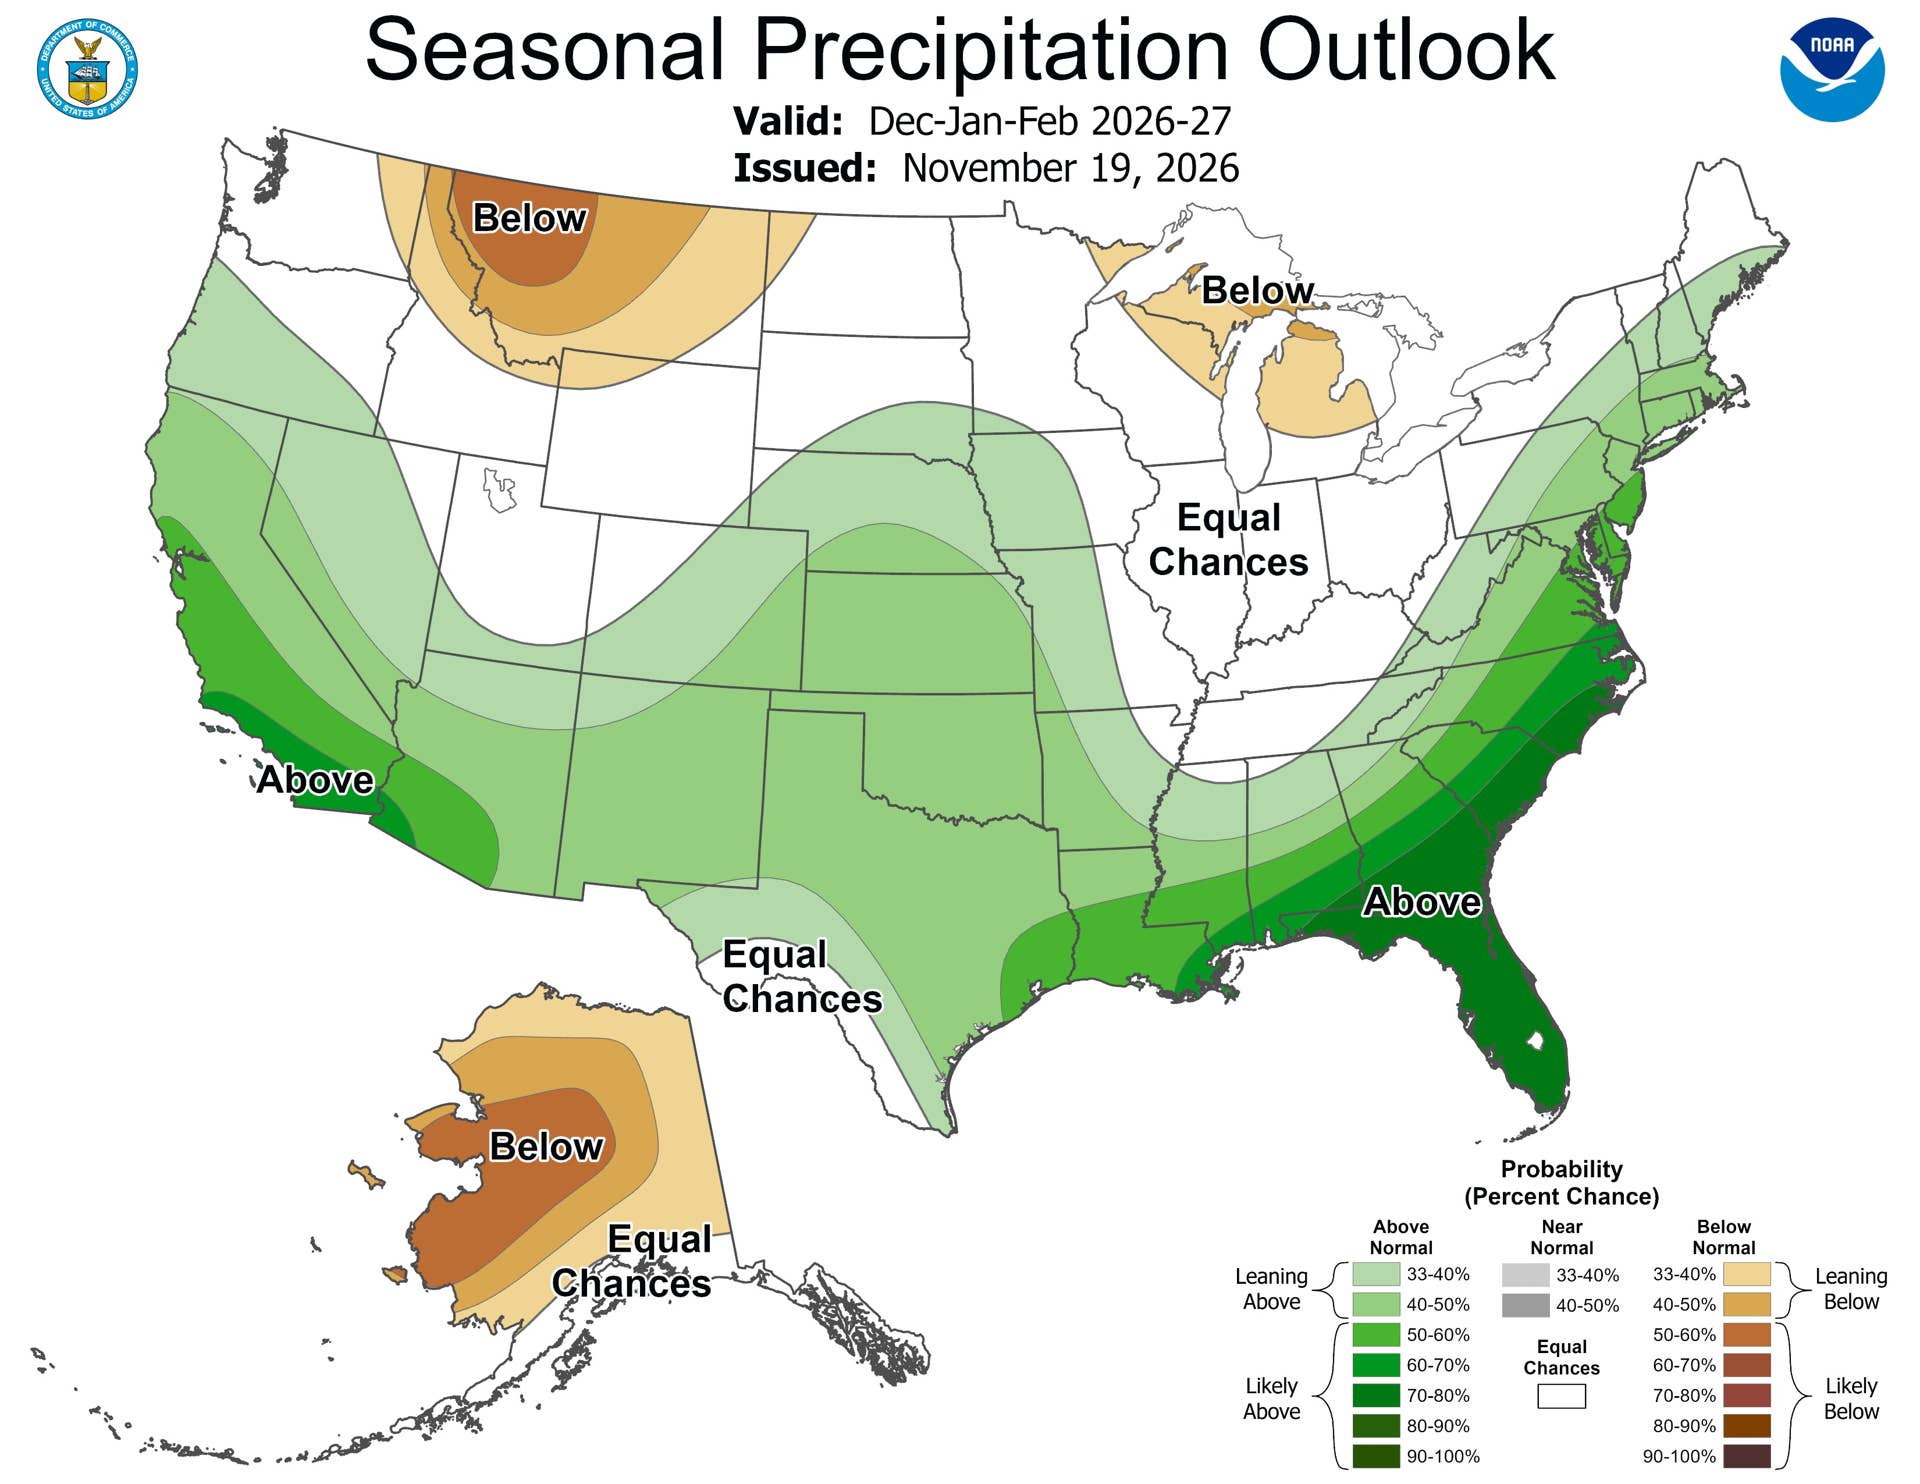
The December through February outlook favors a wet winter from southwestern Oregon and California across the Southwest, the central and southern Plains, the Gulf Coast and most of the East Coast. Odds pass 60 percent in southern California and southwestern Arizona. Compared with the October 15 maps, forecasters raised them across California, the Desert Southwest and the East Coast, and the seasonal discussion says they trust this winter’s precipitation outlook more than its temperatures.
NOAA / Climate Prediction Center
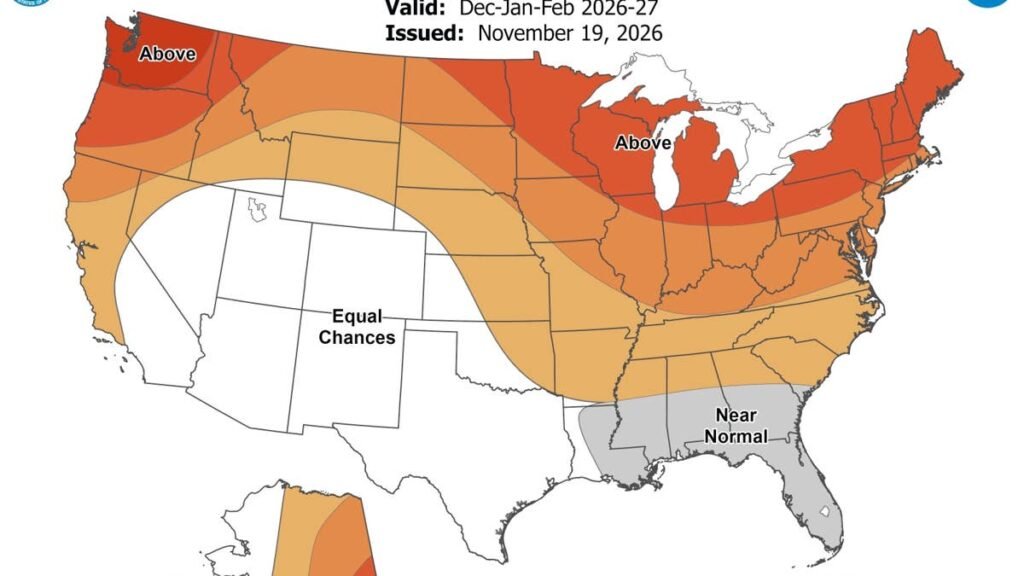
On the temperature map, most of the northern two-thirds of the country leans warm, with 50 to 60 percent odds from the Great Lakes to Maine. Western Montana leans both warm and dry, with 50 to 60 percent odds of below normal precipitation.
Which States Have The Best Snow Setup
NOAA’s seasonal maps don’t forecast snow directly, so the places to watch are the ones where a wet signal meets temperatures that aren’t tilted warm. A large block covering most of Nevada, Utah, Colorado, Arizona, New Mexico and western Texas has no temperature lean either way. Where it overlaps the wet signal, in Arizona, New Mexico, southern Utah, southern Colorado and southern Nevada, the higher terrain has better odds of turning that extra moisture into snow. That includes the Mogollon Rim and the high country around Flagstaff, the Sangre de Cristo and San Juan Mountains, and the plateaus of southern Utah.
The Sierra Nevada sits at the edge of that block, with odds of above normal precipitation mostly between 40 and 50 percent over the range and only a weak warm lean along the California coast. At pass level and above, a larger share of that extra precipitation is likely to fall as snow. On the Plains, Kansas, Oklahoma, the Texas Panhandle and southern Nebraska also lean wet, at 40 to 50 percent in places, under only a slight warm tilt, so an occasional southern storm that pulls in cold air would have more moisture to work with.
From the Mid-Atlantic to Maine, the map stacks a wet signal on top of 50 to 60 percent warm odds. A warm lean over three months still leaves room for individual cold storms, so snow there will come down to whether cold air is in place when a coastal storm arrives.
What It Means For Drivers In Arizona And New Mexico
The two states at the center of the snow signal carry I-40, I-17 and I-25 over high, exposed terrain. Arizona’s Department of Transportation names northbound I-17 out of the Verde Valley toward Flagstaff and eastbound I-40 at Ash Fork Hill, just west of Williams, as stretches that have closed temporarily when storms intensify. ADOT advises carrying plenty of fuel, blankets and water, since those closures can last for hours, and on busy snow days traffic back to Flagstaff from the snow-play areas along US 180 builds through the afternoon.
New Mexico’s trouble spots sit on the same storm track. In past storms, I-25 has closed at Raton Pass and I-40 at Clines Corners and Tucumcari, and the state DOT warned in January of very difficult to potentially impossible travel along I-40 from Tijeras Canyon to the Texas state line.
The next set of seasonal maps arrives December 17.