Editors’ Vox is a blog from AGU’s Publications Department.
After 18 years of data collection, quality control, processing, and archiving, the United States Magnetotelluric Array (USMTArray) data set was completed in 2024. A new article in Reviews of Geophysics introduces this unprecedented data set and a new high-resolution model of the Earth’s crust and upper mantle that was made possible because of it. Here, we asked the authors to give an overview of magnetotellurics, how the USMTArray was developed, and future directions for research.
In simple terms for a non-specialist, what is the science of magnetotellurics?
Magnetotellurics (MT) is a passive geophysical technique capable of imaging the subsurface from hundreds of meters to hundreds of kilometers depth using the Sun and global lightning as sources. The science behind MT is largely based on Faraday’s law of induction, where external magnetic field variations induce telluric (from the Latin word ‘tellus’ meaning Earth) currents in the conducting Earth. These magnetic field variations are constantly occurring and happen over a wide range of time scales ranging from milliseconds to hours. And they are tiny – typically on the order of 0.1% of Earth’s magnetic field amplitude and even during intense magnetic storms rarely exceed 1%.
By measuring these magnetic variations, and the induced electric field variations at Earth’s surface, we can constrain the 3D distribution of conductivity in the Earth. MT is an elegant method – we exploit powerful and distant energy sources which we have no control over and can mathematically remove the stochastic source spectrum to recover reliable estimates of Earth impedance. Impedance can be thought of as the Earth filter – a complex, frequency dependent set of functions that encapsulates all the information about the 3D conductivity structure beneath our feet. Through numerical inversion of impedance data at an array of sites, we build up 3D models of electrical conductivity.
What are some of the applications of the magnetotelluric method?
MT is applied across a broad spectrum of the Earth and space sciences ranging from mineral and geothermal resource investigations, to fundamental geologic and tectonic studies, to imaging the magmatic plumbing systems of active volcanoes, and to hazard mapping centered upon geomagnetically induced currents and the risk they pose to power grids.
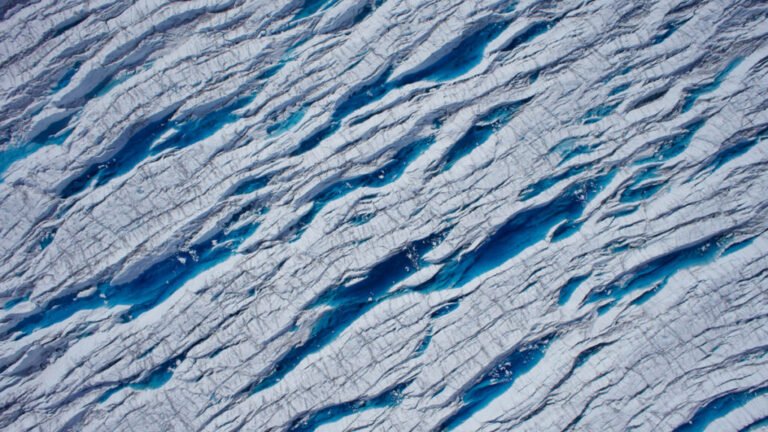
Studies using MT are performed on every continent and in all tectonic settings, on land and on the ocean floor, on the Antarctic ice sheet, and even on the Moon. Because of its ability to image the entire lithospheric column, MT studies have made important contributions to our understanding of continental assembly by revealing ancient orogens and rifts. Moreover, MT is uniquely able to constrain the stability of cratonic roots by mapping hydration of the mantle lithosphere. MT studies are key to understanding active tectonic processes, including constraining the water budget in subduction zones, imaging melt zones beneath orogenic plateaus, and mapping the extent of crustal extension – for example beneath the western U.S.
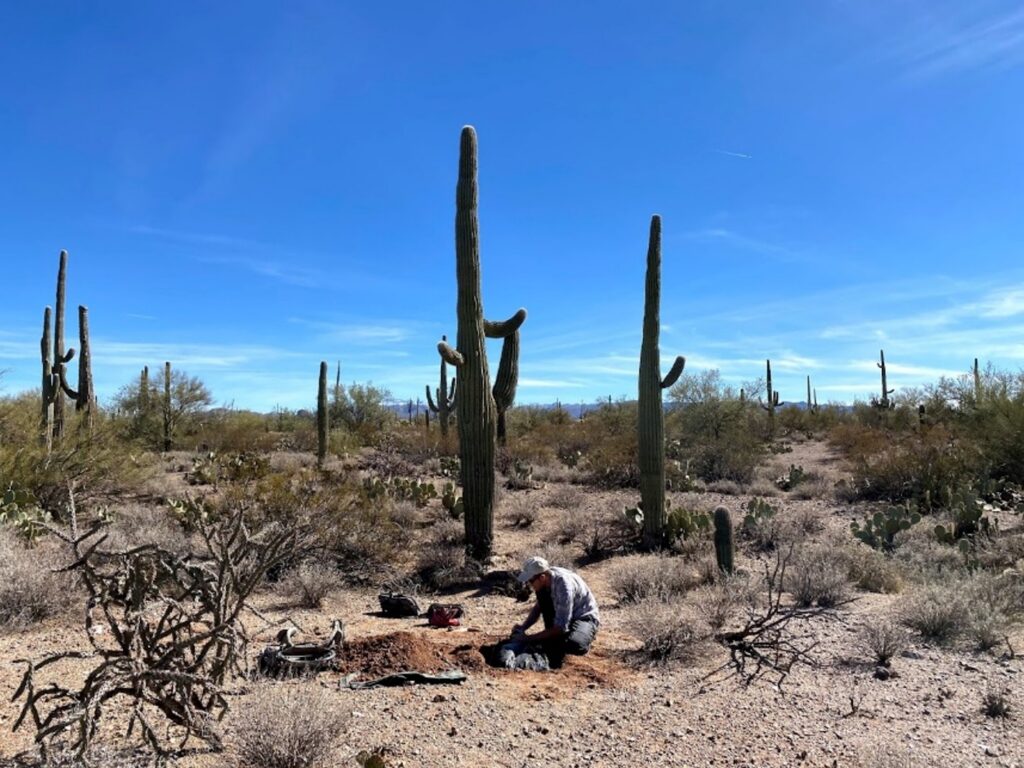
With the rise of computational power and 3D modeling and inversion codes, MT is now routinely used to study complex 3D systems, such as active volcanoes, geothermal systems, and mineral deposits. The sensitivity of MT to minor conductive phases – be it partial melt, clay, or conductive minerals such as graphite and metallic sulfides – make it ideal for studying these types of systems. As a result, MT is commonly employed within the resource sector at both the district and deposit scale. Many of the world’s iconic volcanoes have also been imaged with MT, where they constrain the geometry of crustal melt reservoirs – especially their volume and melt fraction which is in turn linked to the eruptibility of a subsurface magma. These analyses are especially powerful because they are sensitive to a distinct physical parameter – resistivity – of Earth materials. MT therefore provides unique and complementary information about the subsurface across a wide range of scales and is a particularly invaluable tool when other methods yield non-unique interpretations.
One somewhat unexpected application of MT has been to space weather hazards. It was recognized a little over a decade ago that MT impedances are key to estimating surface electric fields generated during intense geomagnetic storms that can impact electric power grids. Past storms have knocked out power to vast areas and damaged critical infrastructure such as transformers. The importance of MT data to scenario analysis, in which power grid components are ‘stress tested’ against past geomagnetic storms, cannot be overstated. Regional to national-scale geoelectric hazard maps, both in the U.S. and internationally, are also informed by MT data, as are real-time geoelectric hazard estimates.
What is the United States Magnetotelluric Array (USMTArray)?
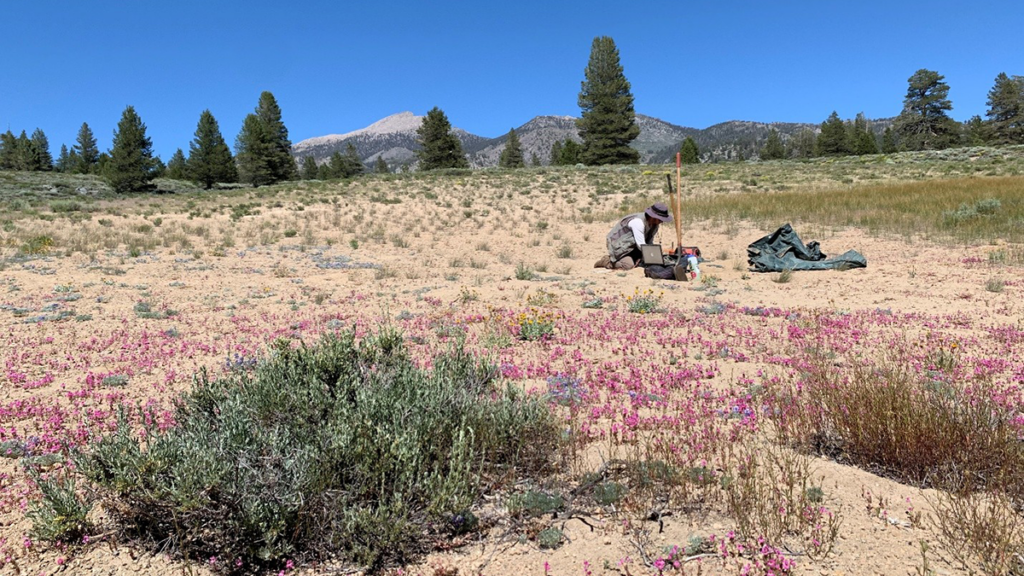
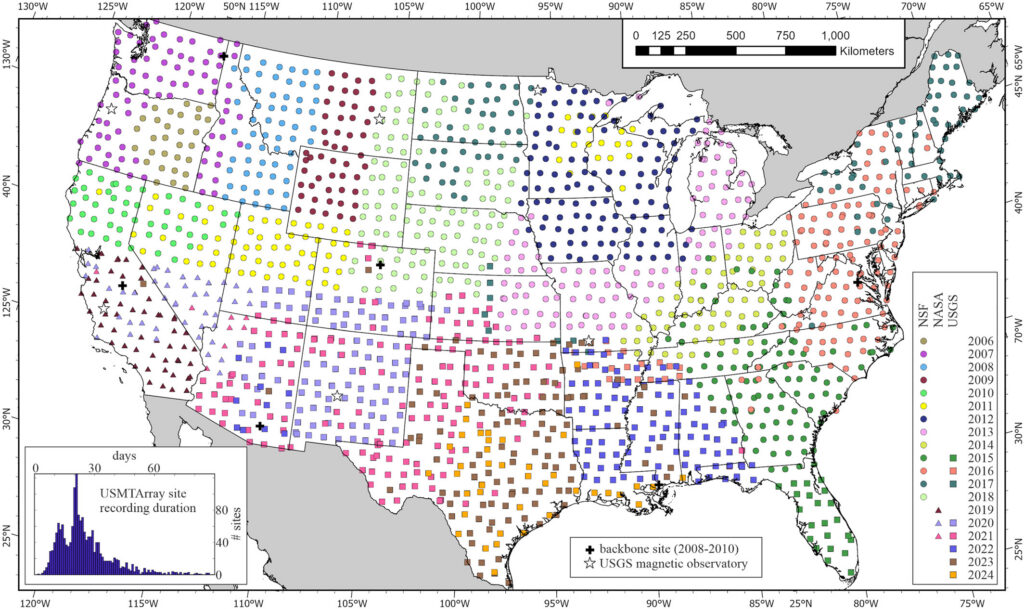
The USMTArray was an ambitious program begun in 2006 under the NSF-funded EarthScope program and completed in June of 2024 under USGS funding. The USMTArray collected long-period MT soundings on a 70-km grid across the contiguous U.S. – totaling more than 1,800 stations – each collected with uniform instrumentation, acquisition parameters, data processing, archiving, and metadata. Funded throughout its 18-year lifetime by three different federal agencies (the NSF, NASA, and USGS working closely with the Incorporated Research Institutions for Seismology and Oregon State University), the data – time series, response functions and metadata – were released incrementally to the public without data embargo or usage restriction.
In broad terms, how was the USMTArray developed?
The USMTArray had humble beginnings – being mentioned in early planning documents as having value in understanding subduction zones and characterizing volcanic systems. Funded by NSF in 2003, the MT component of EarthScope was modeled after the much larger seismic component, with a transportable array of instruments to march across the U.S. on a 70-km spaced grid and a backbone array of seven instruments to study deep mantle structure. The USMTArray started off small and before dedicated instruments were even available. In 2006, a pilot study collected the first 30 stations in eastern Oregon using borrowed instruments, while subsequent years expanded what became known as the ‘northwest’ footprint, a 331-sites array completed in 2011 encompassing the Yellowstone-Snake River Plain, the Northern Rocky Mountains, the Cascades magmatic arc, and the northern Basin and Range province. Subsequent footprints in the midcontinent and the eastern U.S. continued to expand coverage.
What were some of the challenges in developing the USMTArray?
The biggest challenge by far was money. Within the EarthScope program, the USMTArray was never funded at the level needed to cover the contiguous U.S. The MT component was instead carried out as a series of footprints in areas deemed most scientifically advantageous. This limitation, however, led to one of the big successes of the USMTArray – active community engagement. Siting workshops held in 2008 and 2013 brought together participants from academia, government, and industry to discuss and prioritize where the array would go next, while a community working group provided scientific and operational guidance throughout the life of the array. The success of the USMTArray was recognized early on by the community governance of the EarthScope facility activities, with the ‘full-48’ concept endorsed in 2009, leading to modest increases in funding and an acceleration of station completions. In 2018, by the end of NSF-sponsored activities, roughly 2/3 of the contiguous U.S. had been covered. Seeing the array to completion, however, required additional funding, a challenge met by NASA (2019-2020) and the USGS (2020-2024), in large part due to recognition of the importance of USMTArray data to space-weather hazards and supported through executive orders in 2016 and 2019.
Another notable challenge that we faced while developing the USMTArray operations was the absence of established data sharing practices within the magnetotelluric community. Indeed, the concept of FAIR data was only introduced in 2016. Back in 2006 when this program commenced, the concepts of open data and systematic data sharing were largely unfamiliar, and no widely adopted, sustainable data formats existed. Available data formats were lacking in flexibility, consistency, and self-descriptive metadata. As the project progressed, our team developed such formats and accompanying databases, which have now reached maturity and are helping to drive more sustainable MT data‑sharing practices internationally.
How has the development of the USMTArray advanced the scientific field?
The USMTArray, along with parallel advances in modeling capabilities and increased computational power, ushered in a jump to 3D MT and to interrogating the Earth at regional to national scales. National-scale conductivity models, such as those developed from the USMTArray, now join the ranks of other data sets like magnetic, gravity, and seismic, and are a new lens with which to view the architecture of the North American continent. Numerous contributions to continental architecture and assembly and to understanding active tectonic processes have come from the USMTArray.
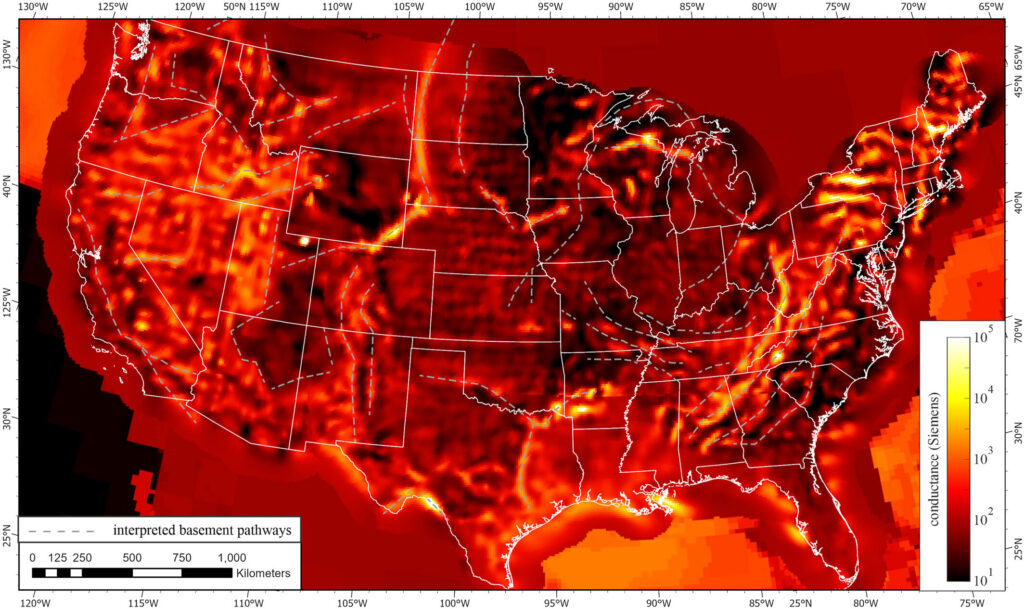
The USMTArray also serves as a framework for more detailed studies, allowing Principal Investigators (PIs) to derisk future surveys and industry to investigate anomalous or unexpected structure. Studies of the Cascadia subduction zone and the adjacent magmatic arc and geothermal energy prospectivity studies in the Oregon Cascades and Great Basin have been built upon the USMTArray while new MT surveys along the eastern seaboard are collecting high-resolution MT data to improve space-weather hazard maps over areas identified as particularly at risk from the analysis of USMTArray data.
Beyond the data and models derived from them, the USMTArray has motivated methodological advances, led to an investment in MT instrumentation and open-source software for researchers within the NSF-supported National Geophysical Facility, and served as a model for other regional and continental scale MT experiments.
What are some of the future directions for research in continental scale magnetotellurics?
With completion of the USMTArray, and the 3D conductivity models derived from it, there are numerous avenues for future research. Most models of continental evolution, for example, were developed prior to the advent of this rich data set. Critically evaluating such models in light of this new data set is paramount, and initial studies are already forcing a reexamination of certain paradigms.
Multi-disciplinary studies incorporating geochronology, geochemistry, and rapidly evolving seismic models is another promising area as is the coupling of geophysical models to geodynamic models to examine the evolution of newly imaged model structure. Similarly, advancements in integrated and joint inversion are promising directions to leverage the wealth of public data sets available at regional to continental scales.
Geology doesn’t stop at national borders or the land-sea interface – additional opportunities exist for cross-border arrays and onshore/offshore MT studies. Investigation of subduction zone processes and rifted continental margins by their very nature demand an amphibious approach.
On the applied front, resource assessments increasingly are applied at national and even global scales and demand data support at these same scales. Mineral resource assessments, for example, in the U.S., Canada, and Australia are exploring machine learning approaches to map prospectivity for various deposit types and incorporate a range of geophysical data layers to do so. Similarly, geothermal assessments can benefit from the consistent and synoptic data coverage offered by USMTArray data and models.
Finally, on the space-weather hazards front, partnering with power-system engineers to investigate data scale and uncertainty shows promise in generating accurate hazard maps and in improving upon operational, near real-time geoelectric field models. For all these future research directions the USMTArray remains both a framework and a benchmark upon which to build.
—Paul A. Bedrosian (pbedrosian@usgs.gov;  0000-0002-6786-1038), U.S. Geological Survey, United States; Anna Kelbert (anna.kelbert@cfa.harvard.edu; 0000-0003-4395-398X), Center for Astrophysics | Harvard & Smithsonian, United States; Adam Schultz (adam.schultz@oregonstate.edu; 0000-0003-1663-1547), Oregon State University, United States; and Gary D. Egbert (gary.egbert@oregonstate.edu; 0000-0003-1276-8538), Oregon State University, United States
Editor’s Note: It is the policy of AGU Publications to invite the authors of articles published in Reviews of Geophysics to write a summary for Eos Editors’ Vox.
Citation: Bedrosian, P. A., A. Kelbert, A. Schultz, and G. D. Egbert (2026), Mapping the hidden electrical anatomy of a continent, Eos, 107, https://doi.org/10.1029/2026EO265021. Published on 26 May 2026.
This article does not represent the opinion of AGU, Eos, or any of its affiliates. It is solely the opinion of the author(s).
Text © 2026. The authors. CC BY-NC-ND 3.0
Except where otherwise noted, images are subject to copyright. Any reuse without express permission from the copyright owner is prohibited.