NOAA put the chance of a very strong El Niño at 81 percent in July. A month later, the Climate Prediction Center raised that above 90 percent for fall and winter 2026-27 and gave October to December a 69 percent chance of exceeding every El Niño in a record that reaches back to 1950.
That strengthening signal is now showing up in the winter maps. The seasonal outlook CPC issued on August 20 puts the latest weekly sea surface temperature anomalies in the eastern equatorial Pacific above 3.0 degrees Celsius, warmer than the monthly figures published a week earlier. Nat Johnson, a meteorologist with NOAA’s Geophysical Fluid Dynamics Laboratory, told CNN the event is “something that’s very unusual, if not a once in a lifetime type of (strength).” Forecasters quoted by the network expect it to reach Super El Niño intensity no later than October.
What The Snow Map Shows
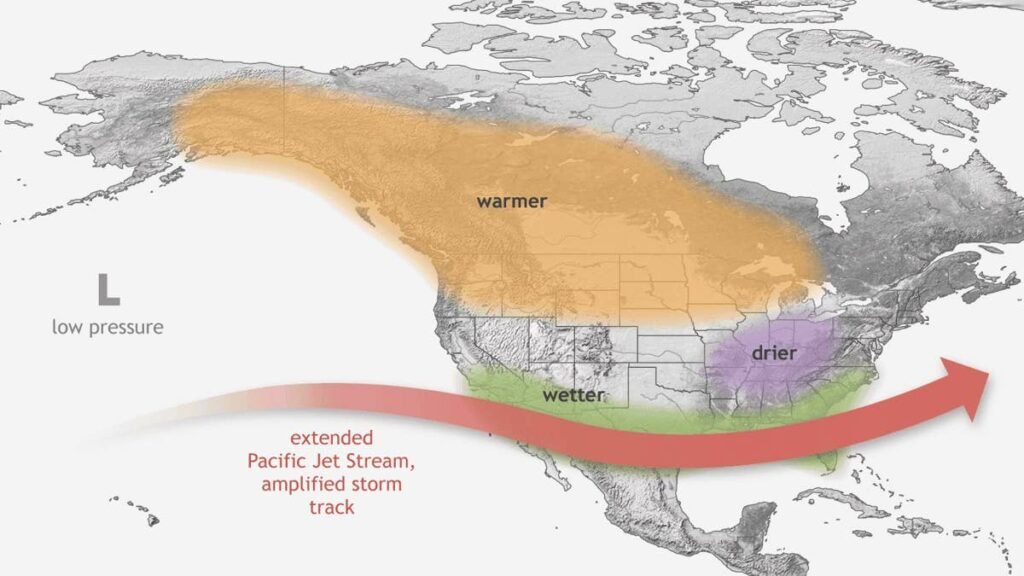
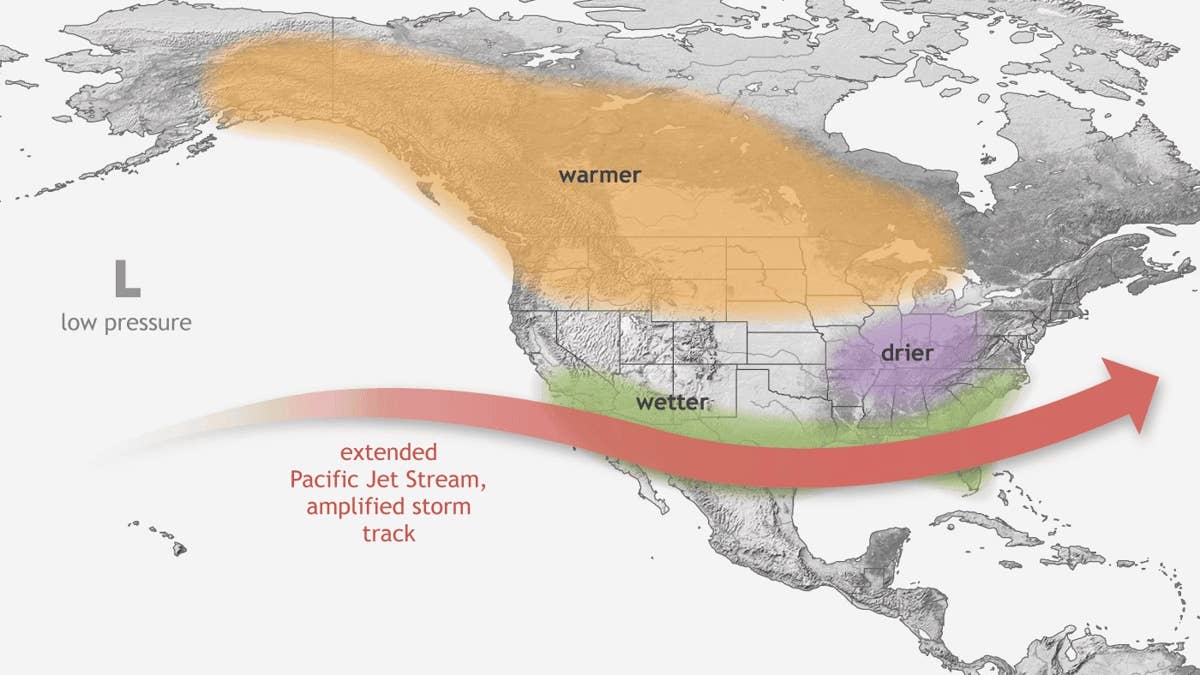
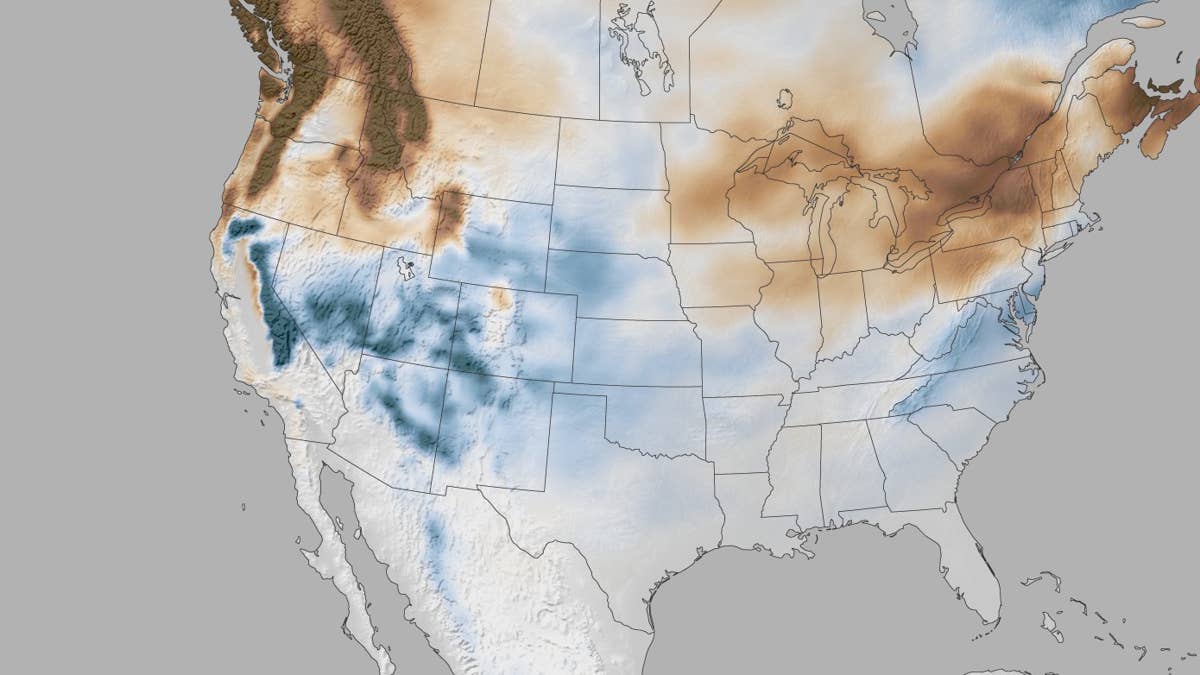
NOAA’s snowfall composite for moderate to strong El Niño winters splits the country into two very different winters. The West and part of the Mid-Atlantic stand out with above normal snowfall, while most of the northern tier trends warmer and less snowy, losing snow to warmth rather than to dry air. A historical snowfall map from the Weather Channel shows a similar divide.
The split has a straightforward explanation.
NOAA
El Niño is a natural cycle of warmer than average water along the equator in the Pacific, and the atmospheric shifts above it push the North American storm track south while leaving the northern tier warm.
The West
climate.gov
California, Nevada, Utah and Arizona carry the strongest signal on the map. The August 20 outlook lifted the odds of above normal precipitation past 50 percent for coastal California and southern Arizona, with the widest coverage from January through March. Forecasters pointed to earlier eastern Pacific events that brought copious precipitation to the West Coast late in winter, two of which, in 1998 and 2024, produced among the wettest Februaries in a century for parts of California.
A separate snowfall anomaly map published by the Sacramento Bee puts the Sierra Nevada well above normal through the season, with the sharpest spike in January.
The ski industry has already moved on it. Bill Rock, who runs Vail Resorts’ mountain division, said in the company’s season opening announcement that “the possibility of blockbuster snowfall has us feeling optimistic about the winter ahead,” while allowing that nobody can predict what actually falls. Heavenly and Northstar are targeting November 20, which puts Tahoe traffic on the passes before Thanksgiving.
The East
The second band runs through Virginia, Delaware and southern New Jersey. The Southeast tips past 60 percent for above normal precipitation by late fall, and the same tilt holds along nearly the whole East Coast from late autumn into spring.
What sets this band apart from the western one is that snow and ice can have a bigger impact in a region that typically sees fewer major winter storms.
The Northern Tier
The drier side of the forecast covers the northern Rockies and northern High Plains, with a weaker lean over the Great Lakes. Across the rest of the northern states the moisture is closer to normal and the temperature is what thins the snow.
A warmer, less snowy winter across the northern Rockies and upper Midwest does not remove the freeze-and-thaw cycling that breaks up pavement by February.
What The Map Means For Winter Driving
Temperature is what separates a snow forecast from a driving forecast. CPC has above normal temperatures above 50 percent from the Pacific Northwest to the Northeast by midwinter, so much of that extra moisture arrives near the freezing line rather than well below it.
In the Sierra that shows up as snow levels climbing and dropping inside a single storm, with chain controls going up and coming off within hours and rain landing on packed snow at pass elevation. The roads carrying that traffic are I-80 over Donner Summit, US-50 over Echo Summit and the Mount Rose Highway into Reno. Utah’s share of the band runs along I-80 over Parleys Summit and the canyon roads above Salt Lake City, and Arizona’s sits on I-17 climbing to Flagstaff and I-40 across the north.
On the eastern side the exposure is different. Virginia’s portion of the band follows I-81 through the Shenandoah Valley and I-64 over Afton Mountain. In Delaware and southern New Jersey it is the I-95 corridor and the bridges over the Delaware River, where elevated decks freeze while the approaches stay merely wet.
Where The Ice Risk Sits
Along the southern edge of the wet signal, temperatures sit near freezing rather than below it, and that narrow band produces freezing rain instead of snow. Autoblog looked at the cost earlier this week: one January ice storm killed 171 people, more than every other billion-dollar weather disaster in the country in the first half of 2026 combined.
CPC attaches the same caveat to every update, that an event this size raises the odds of typical El Niño impacts without guaranteeing them in any one place. The analogs also point to a delayed start, which puts the heaviest weeks after the holiday travel window. The next ENSO discussion is due September 10.