
Want more housing market stories from Lance Lambert’s ResiClub in your inbox? Subscribe to the ResiClub newsletter.
During the Pandemic Housing Boom, housing demand surged rapidly amid ultralow interest rates, stimulus, and the remote work boom. Federal Reserve researchers estimate “new construction would have had to increase by roughly 300% to absorb the pandemic-era surge in demand.”
Unlike housing demand, housing stock isn’t as elastic and can’t quickly ramp up. As a result, the heightened demand drained the market of active inventory and caused home prices to overheat, with U.S. home prices in June 2022 sitting a staggering 43.2% above March 2020 levels.
Since that national boom ended in mid-2022, the housing market has been moving through a cyclical cooling phase and undergoing a period of recalibration and normalization after such a large burst.
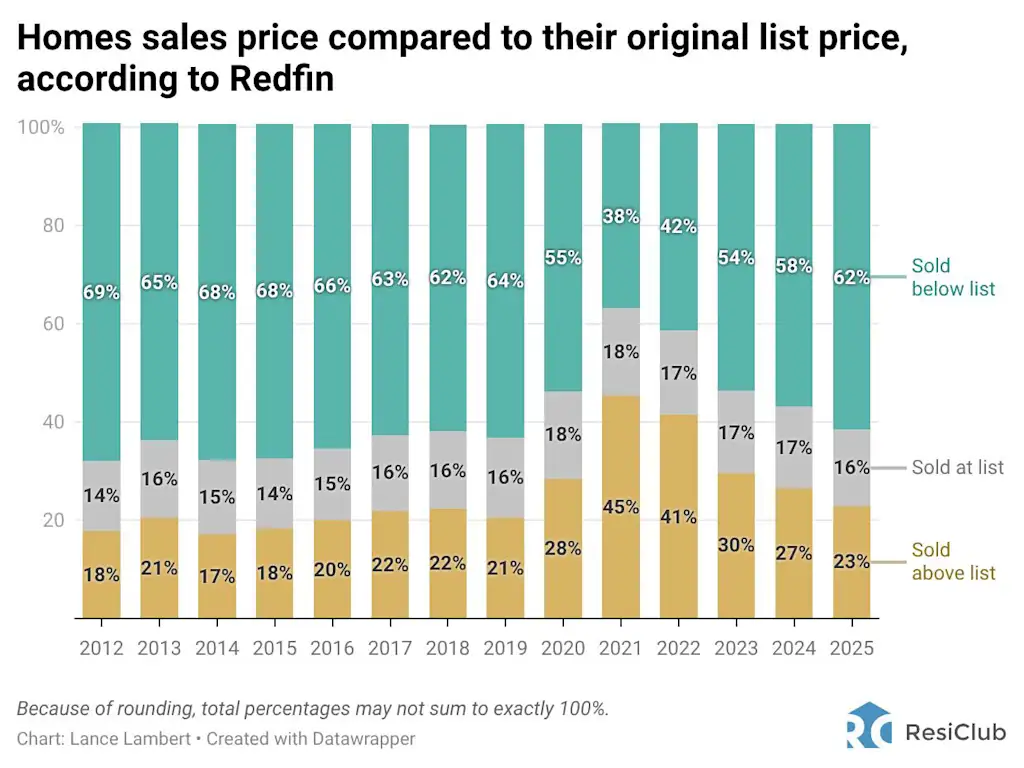
Look no further than the share of U.S. homes that sold below their original list price, by year, according to a new Redfin report:
- 2018 —> 62%
- 2019 —> 64%
- 2020 —> 55%
- 2021 —> 38%
- 2022 —> 42%
- 2023 —> 54%
- 2024 —> 58%
- 2025 —> 62%
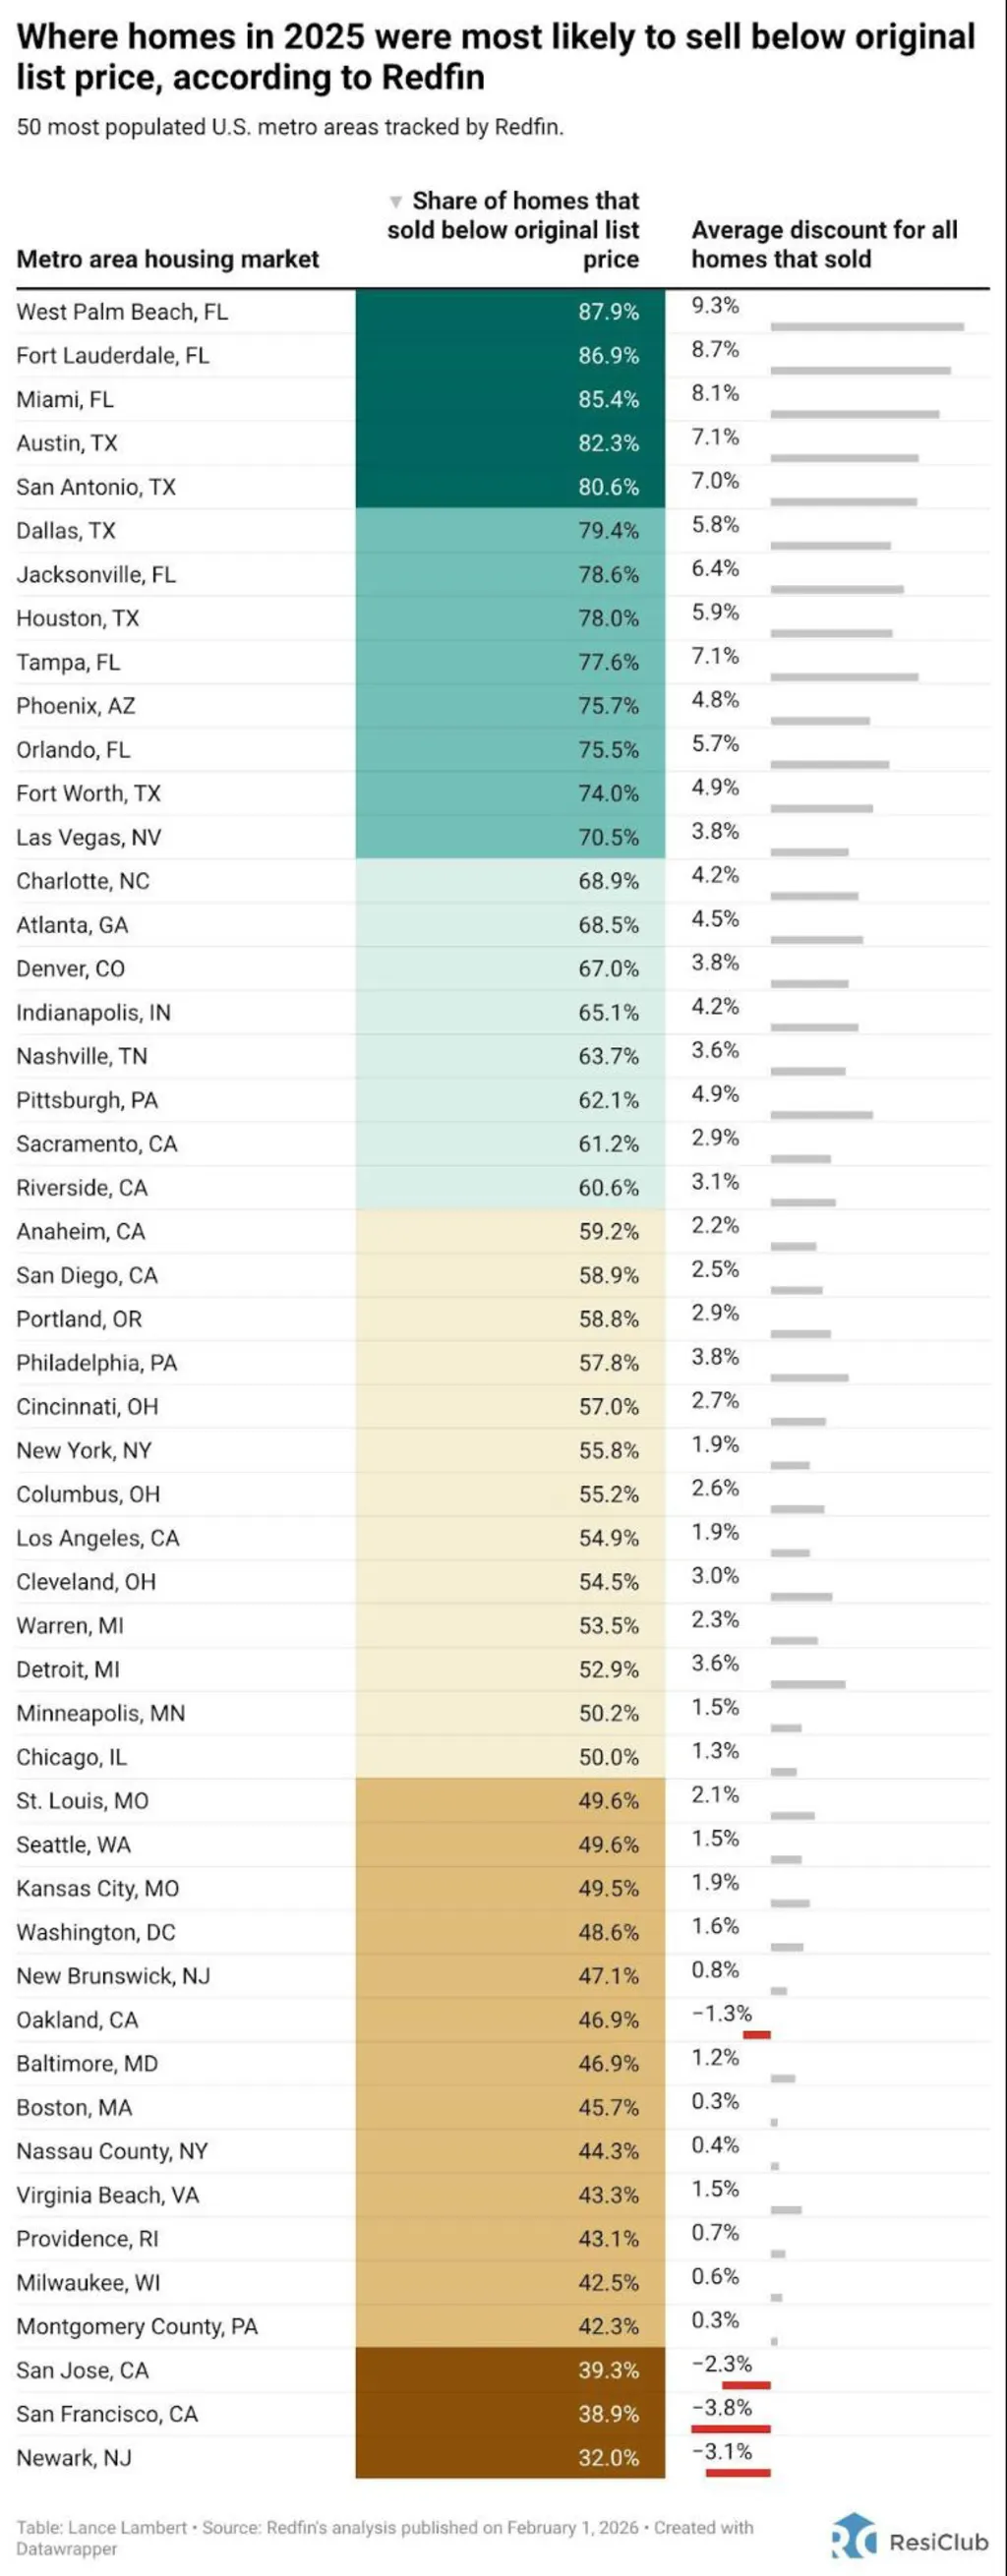
The share of homes selling below their original list price varies by region. Many Sun Belt pandemic-boom markets—particularly across Florida and Texas—are seeing the highest prevalence of homes selling below their initial ask.
By contrast, many Northeast and Midwest metros remain, relatively speaking, more resilient, with fewer than half of homes selling below list in several markets. Parts of San Francisco and San Jose have regained a bit of mojo amid the AI boom.
“Some sellers are recognizing the market has changed and others are not . . . I have one seller who overpaid for their home a few years ago and wants to list it at $950,000. The problem is recent comps call for a list price of $825,000,” writes Connie Durnal, a Redfin Premier real estate agent in Dallas. “I have another seller who paid $400,000 for their home but was willing to list it at $385,000, which was a great strategy. Because the home was fairly priced, it got multiple offers and sold for $10,000 over the asking price.”
Redfin’s analysis is based on annual MLS data comparing original list prices with final sale prices. The firm didn’t publish data for every metro.