A new paper in The Lancet Planetary Health uses real registration data and satellite readings to show that as zero-emission vehicles increase in California neighborhoods, nitrogen dioxide levels drop measurably over the same years.
ZEV Growth And The Dataset Behind The Claim
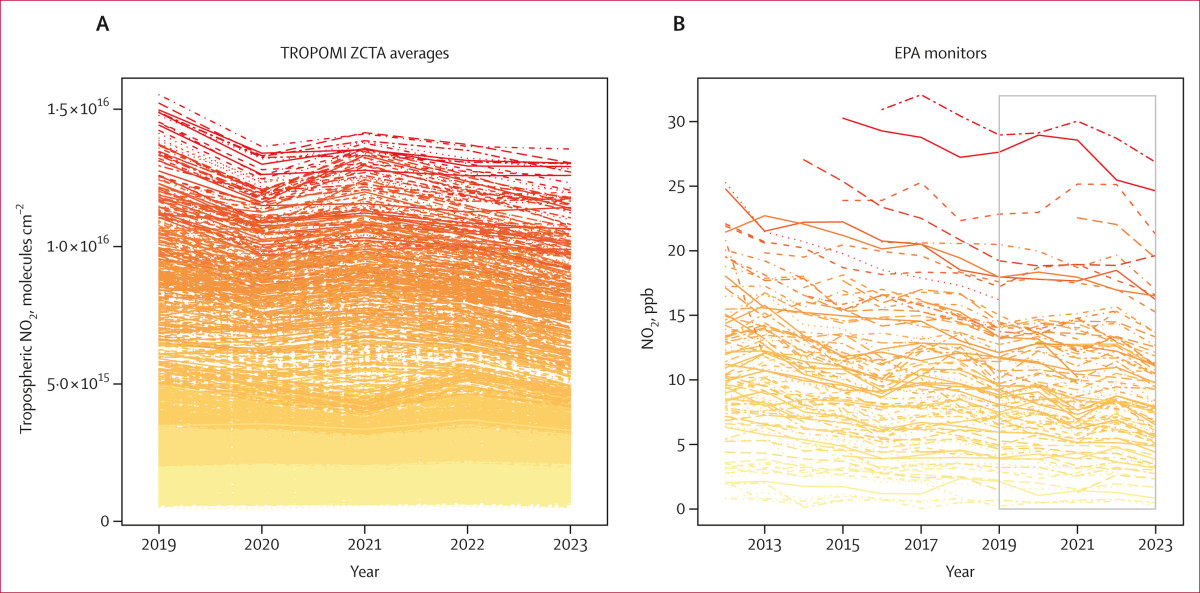
Researchers matched yearly changes in zero-emission vehicle registrations with yearly average nitrogen dioxide levels, using satellite measurements across California from 2019 through 2023. They looked at 1,687 ZIP Code Tabulation Areas, which are Census versions of ZIP codes, covering essentially the entire state’s population.
Over those five years, zero-emission vehicles grew from a small slice of California’s light-duty fleet to a noticeably larger one, while the number of gas vehicles on the books did not swing dramatically. The study also compared the satellite pollution readings to ground stations and found they tracked closely enough to support neighborhood-level analysis.
The Key Result In Plain Numbers
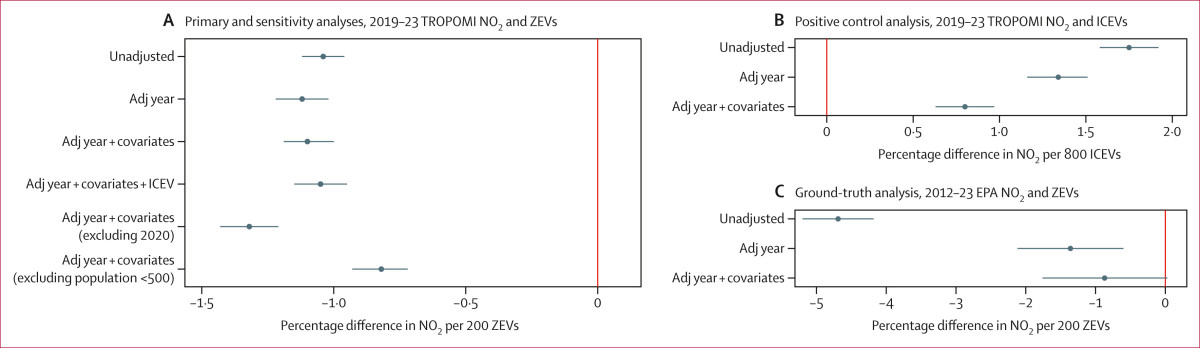
After the researchers adjusted for broader time trends and local shifts in factors like population, education, work-from-home share, and fuel prices, they found that when a neighborhood added 200 more zero-emission vehicles, its annual average nitrogen dioxide level was about 1.1% lower, with the estimate tightly bounded in the study’s confidence range of -1.19% to -1.00%.
To check that the result was not being driven by unusual conditions in a single year or by very small ZIP areas, they reran the model without 2020 and still saw a similar relationship, about a 1.3% drop per 200 zero-emission vehicles, and when they excluded ZIP areas with fewer than 500 residents they still found a drop, closer to 0.8% per 200 vehicles.
They also ran a “positive control” to confirm the analysis behaved as expected in the opposite direction, and they found that adding 800 gasoline vehicles in a neighborhood was associated with about a 0.8% increase in nitrogen dioxide, which supports the idea that changes in what gets registered locally track with changes in the pollution level measured for that same area.
Finally, they compared the satellite-based approach to a separate “ground-truth” model using 123 EPA monitoring sites over a longer 2012 to 2023 window, and while that check was less precise, it pointed the same way, with the estimate suggesting about a 0.9% drop per 200 zero-emission vehicles and a wider confidence range from -1.76% to 0.03%.
Why This Matters In The Policy Noise
This is a solid, observed air-quality shift tied to real ZEV adoption, which is the kind of evidence that will keep showing up in arguments over standards and enforcement, whether that is overseas concerns, local debates about upstream emissions, or the legal pushbacks involved.