Data is an omnipresent facet of modern existence, yet the current discourse around it is often too technical, academic, and inaccessible to the average person. Speak Data, the book I’ve just published with my coauthor Phillip Cox, emerges from more than 15 years of living and working with data, both as designers and as human beings.
Instead of a textbook or how-to manual for designers, we imagined a more accessible exploration of the human side of data, enlivened by the perspectives of experts and practitioners from many disciplines—from medicine and science to art, culture, and advocacy. In an era when we are all talking about AI, the climate crisis, surveillance and privacy, and how technology shapes our choices, we wanted to reframe data not as something cold or distant, but as something deeply personal: a tool we (as human beings) can wield to understand ourselves and the world better. The book explores what we call Data Humanism, an approach that brings context, nuance, narrative, and imperfection back to the center of how we collect, design, and communicate data.
In this excerpt, organizational psychologist and best-selling author Adam Grant reflects on how we interpret and communicate data, especially in moments of uncertainty, and why stories and emotions are just as essential to understanding information as statistics themselves.
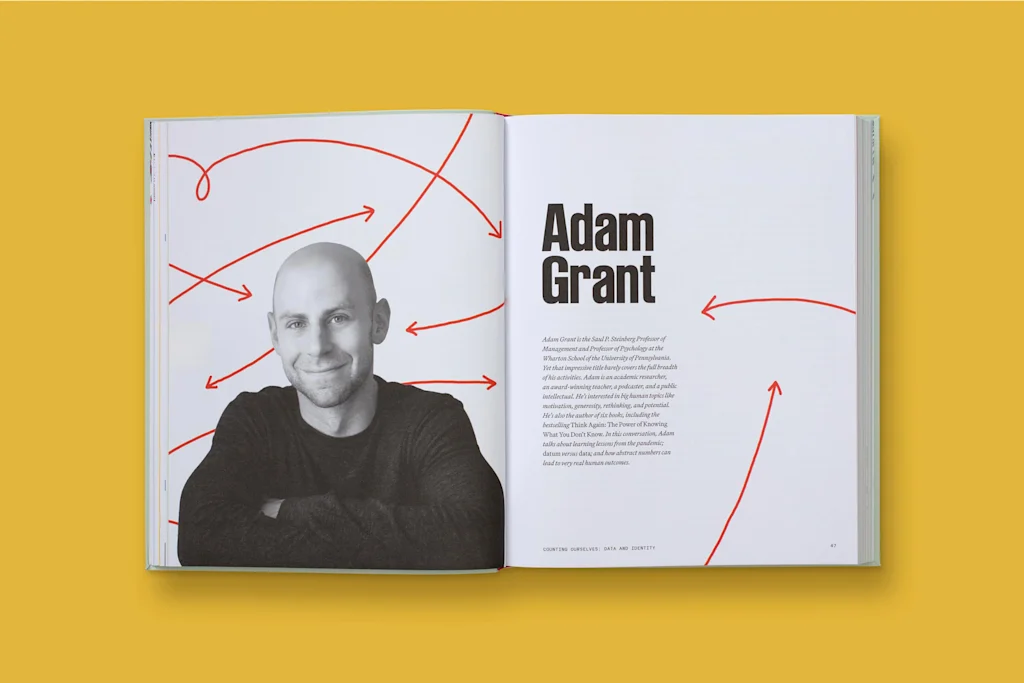
Adam Grant is the Saul P. Steinberg Professor of Management and Professor of Psychology at the Wharton School of the University of Pennsylvania. Yet that impressive title barely covers the full breadth of his activities. Adam is an academic researcher, an award-winning teacher, a best-selling author, a podcaster, and a public intellectual. He’s interested in big human topics like motivation, generosity, rethinking, and potential. He’s also the author of six books, including the best-selling Think Again: The Power of Knowing What You Don’t Know. In this conversation, Adam talks about learning lessons from the pandemic; datum versus data; and how abstract numbers can lead to very real human outcomes.
As a psychologist studying organizational behavior, data is a tool that you use every day. What do you think people get wrong about data the most?
People often have a very hard time accepting data that challenge their intuition or experience. I always want to tell them that if the evidence disagrees with your experience, you shouldn’t immediately say the data are wrong. It might be that you’re an outlier, that your experience is not representative, and the data are actually revealing a trend that you simply don’t fit.
A lot of my work relates to how people interpret social science research, because that’s where I confront the general public. One thing I see a lot is people reading a study and then figuring, well, that study was done with a sample of only a few thousand people in this industry or that country, and dismissing the results because of that. This is basic confirmation bias and desirability bias. You shouldn’t trust your personal opinion over rigorous evidence gathered across many people.
In an article you wrote for The Guardian, you describe arguing with a friend on the efficacy and safety of the COVID-19 vaccine. You wrote, “I had fallen victim to what psychologists call binary bias. It’s when we take a complex spectrum and oversimplify it into two categories. If we want to have better arguments, we need to look for the shades of grey.” This is more or less what you’re talking about. With all that in mind, what is the utility of data?
The analogy I use is medicine. Today we have evidence-based medicine, but once upon a time, medical professionals tried to solve problems via bloodletting and lobotomies. Thanks to randomized controlled trials and careful longitudinal studies, we now have much safer and more reliable treatments. With evidence-based medicine, people are living longer and are healthier.
So now look at how we interpret data from medicine. If you were to summarize all the randomized controlled trials of the average effect of ibuprofen on pain reduction and express the findings in the form of a correlation from -1 to +1, most people would think the correlation would be 0.7 or 0.8. After all, we have a lot of Advil in the world. But in actuality, an analysis showed that the average correlation was 0.14. That’s shockingly low to a lot of people, but the fact that it’s a small effect doesn’t mean it’s insignificant. That’s the first lesson: Patterns in data do not have to be large to be consequential. You play that effect out over millions and millions of people, and a lot of people will benefit. And that benefit will be widely distributed.
Secondly, the treatment doesn’t have the same effect on everyone. There are contingencies. So instead of asking whether Advil is effective, we want to ask: For whom is it effective? When is it effective? This question of when and for whom allows us to look at the data and say: This is real, but only under certain circumstances. Now we need to know how widespread those circumstances are. This is real for some people. What are the commonalities of those people?
The last lesson from medicine is that what’s effective evolves over time. The problems we’re trying to treat can change. We need to update our evidence and ask: What are the best available data on any given question or for solving a given problem? Is there a reason why what was true 10, 20, 30 years ago may not apply today? I would still rather base my opinions on strong evidence that’s old than no evidence at all, but we need to keep an eye on how things evolve as our contexts change.
Exactly. What’s the context? What are the nuances? Data is a snapshot in time. Tomorrow, or in a month, things might be different. Especially when we see data represented in a very definite and defined way, we assume it has absolute power to always represent a situation. This became a problem during the pandemic, of course.
I think the biggest pandemic takeaway regarding the role of data is that experts and public officials did a remarkably terrible job communicating about uncertainty and contingency. I should have known it was going to happen. Chapter 8 in my book Think Again, which I wrote before the pandemic, was about how you don’t lose trust when you say, “More research needs to be done,” or “Here are the initial conclusions, but there are conditions under which they may not hold,” or “Here is what our initial trials suggest. Once we’ve done more trials, we’ll update our conclusions.” And let people know what that process looks like and how the scientific research is not only done, but accumulated.
This is probably the most useful thing I’ve said to a friend of mine who is very skeptical about vaccines after three-plus years of debate. He would say to me, “One study says this and one study says the opposite!” My response is that you shouldn’t weigh both sides equally. You should weigh strong evidence more heavily than weak evidence.
We need to be much more nuanced in how we communicate. We need to clarify where there’s uncertainty. We need to highlight where there are contingencies. We need to be as open about what we don’t know as about what we do know. One of the things we saw during COVID-19 is that source credibility dominates message credibility. People will believe a weak argument from someone they trust much more readily than a strong argument from someone they don’t trust. One of the ways you become a trusted source is by very clearly admitting your uncertainty, showing intellectual humility, and expressing doubt where appropriate. I hope we don’t have to keep relearning that lesson over and over again.
What’s your personal definition of data?
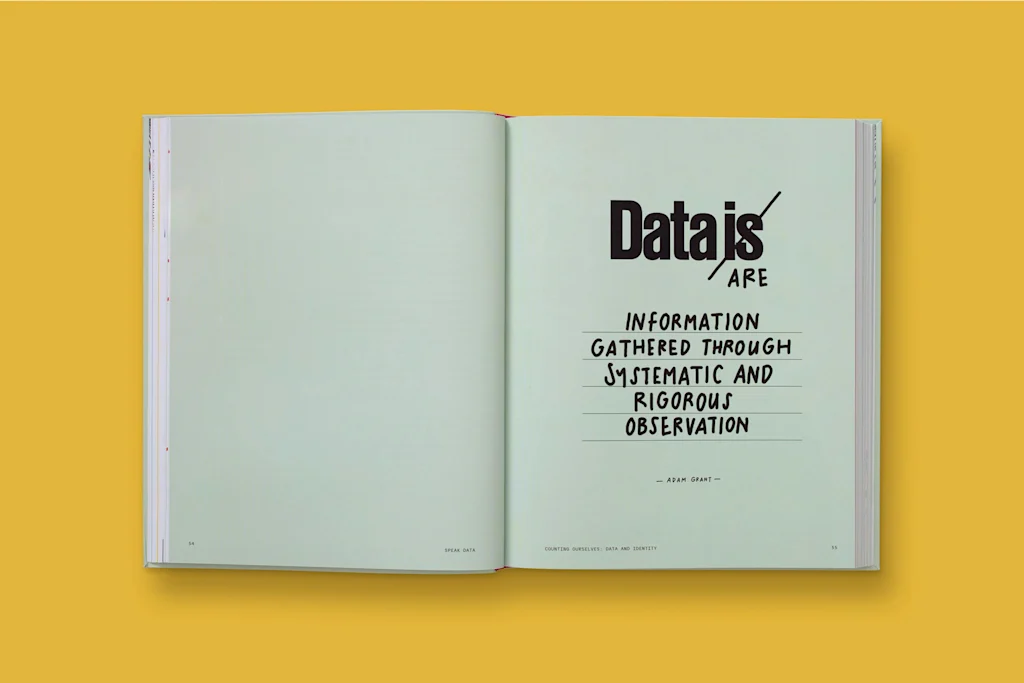
Data are information gathered through systematic and rigorous observation.
We love that you say data are. To us as well, data is plural.
A datum, or a data point, is one piece of information. Data are the collections of those observations.
To change the subject slightly, you’ve spoken in the past about the relative power of data versus stories to influence people and change minds. This is also something we think a lot about in our work. When do you think a really powerful statistic is appropriate, versus when a human story is going to be more effective? And when can they be combined?
It’s a false dichotomy to say they can’t be combined. My point of view on the responsible use of stories is that we should start with the data and then find stories that illuminate the data.
Stories are often more effective at evoking emotion. They allow us to distance ourselves from our own perspectives a bit. In addition to immersing ourselves in the narrative, they immerse us in a character. We get transported into stories, and we tend to experience them more than we evaluate them. Sometimes that can make people less rigorous in scrutinizing data, and that becomes a problem when the stories aren’t guided by data.
The more surprising data are, the more likely they are to capture attention. If you have data that challenge people’s intuition, you’re much more likely to pique their curiosity. But you have to be careful, because, as the sociologist Murray Davis wrote in his classic paper “That’s Interesting!,” people are intrigued when you challenge their weakly held intuitions, whereas they get defensive when you question their strongly held intuitions. So there’s nuance there.
From a visual perspective, we try to anchor stories in more aggregated data, but then disaggregate them by pulling out a couple of data points that can explain the context. By doing this in a narrative way, it can become more accessible, like a plot of a book. That’s really fascinating.
Another way to tell a story about data is to start with what people would expect, then lead them to overturning their assumptions. People often find that journey revealing and enlightening, and it can become an emotional arc.
Yet another thing I’ve learned is to present a surprising result and then ask people how they would explain it. It opens their minds quite a bit: they generate reasons they find persuasive, and thus become active participants in the dialogue. Instead of preaching your view or prosecuting theirs, you engage them in the process of thinking like a scientist and generating hypotheses. I quite enjoy that.