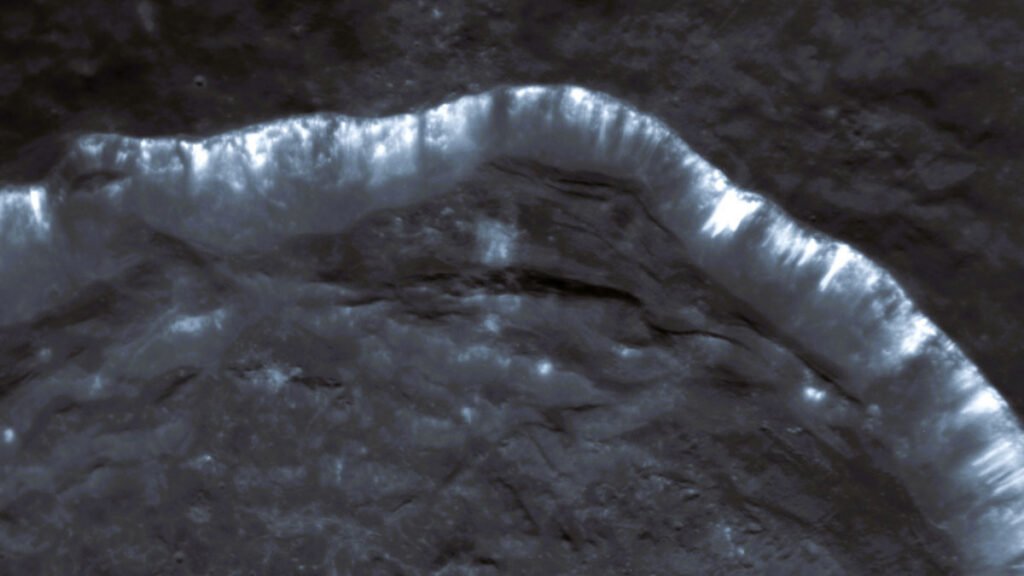
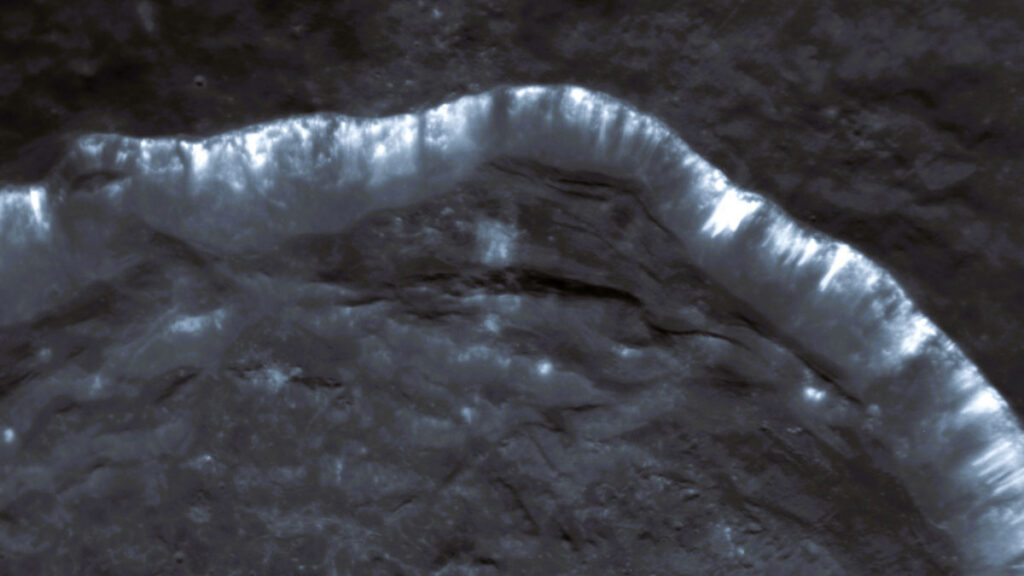
Bright streaks of material trickle down the slopes of many of Mercury’s craters, but scientists have struggled to understand how these geologically young features, called slope lineae, appeared on a seemingly dead world. Now, researchers have used machine learning to analyze more than 400 slope lineae in the hope of understanding the streaks’ origin.
The analysis of images from NASA’s decade-gone MESSENGER (Mercury Surface, Space Environment, Geochemistry, and Ranging) mission showed that lineae seem to stream from bright hollows on the sunward side of crater slopes and mainly appear on craters that punched through a thin volcanic crust to a volatile-rich layer beneath. The lineae, the team theorized, could have formed when that exposed layer heated up and released volatiles like sulfur to drip downslope.
“We have these modern data science approaches now—machine learning, deep learning—that help us look into all those old data sets and find completely new science discoveries in them,” said Valentin Bickel, a planetary geomorphologist at Universität Bern in Switzerland and lead researcher on the study.
Streaks and Stripes
MESSENGER orbited Mercury from 2011 to 2015, and observations from those 4 years remain some of the best data we have on our solar system’s smallest planet.
The images revealed that although there is not a lot of geologic activity happening today, the planet remains chock-full of oddities.
One of those strange phenomena is the existence of slope lineae streaking down from the rims of many of Mercury’s craters. The higher-resolution MESSENGER images show that Mercury’s lineae are made of bright material and are geologically young, with crisply defined edges and no small craters superimposed on top. But planetary scientists had not conducted any systematic analysis of lineae before now, focusing instead on understanding the planet’s similarly bright, but more numerous, hollows.
“The first things we as geologists like to do is put things on a map.”
Bickel and his team sought to fill that knowledge gap. Their machine learning tool looked at more than 112,000 MESSENGER images with spatial resolutions finer than 150 meters (492 feet), identified 402 individual lineae, and cataloged their properties in a uniform way.
“The first things we as geologists like to do is put things on a map,” Bickel said.
Most of MESSENGER’s high-resolution images cover the northern hemisphere, Bickel explained, so most (93%) of the lineae the team cataloged were in the north. Ninety percent of lineae are located within craters. They are hundreds or thousands of meters long, are less than 20 meters (65 feet) tall, and are located on steeper-than-average crater slopes. Most lineae extend from young, bright hollows or hollow-like features.
But the most telling commonality among lineae is that they prefer the side of craters facing the equator, which is the side that receives the most sunlight.
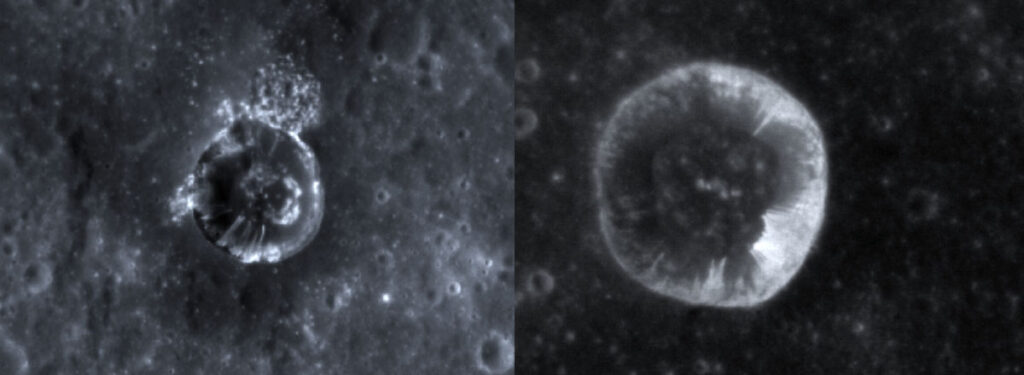
That trend led the researchers to their theory of how lineae form. An impact exposes Mercury’s shallow but volatile-rich bedrock layer. Insolation, or heat from the Sun, draws out volatile gases in those rocks, and those volatiles then slowly drip down the crater wall, leaving bright deposits behind.
“The fact that lineae are on slopes that are facing the Sun implies that insolation might play a role in activating the process,” Bickel said. “And whenever insolation is so prominent, that implies that volatile material is involved. And in Mercury’s case has to come from the subsurface.”
The team published these results in Communications Earth and Environment.
Making a More Complete Map
Susan Conway, a planetary geomorphologist at the French National Centre for Scientific Research (CNRS) in Nantes, France, said planetary scientists have long accepted that Mercury’s hollows are produced by the loss of subsurface volatiles.
“Given that the slope lineae often originate at what appear to be hollows on the crater wall and have the same colour as them, the inference that slope lineae are also linked to volatile loss makes sense,” Conway wrote in an email.
Across the solar system, “slope lineae are pretty common,” added Conway, who was not involved with this research. “Several different kinds have been documented on Mars—slope streaks believed to be dust avalanches, recurring slope lineae whose formation is still debated and could be related to volatiles.” Granular flows on the Moon as well as lineae on Ceres and some icy moons in the outer solar system also resemble those on Mercury.
But a good 10% of Mercury’s known lineae don’t appear within craters, and conversely, there are plenty of craters with hollows that don’t have lineae. Other mechanisms are likely at work there, Bickel said.
“BepiColombo will image the whole surface at a resolution that would enable us to see most slope lineae.”
Thankfully, planetary scientists won’t have to wait long to test this theory. The BepiColombo spacecraft will arrive at Mercury in November and will begin science operations in early 2027. The joint mission from the European Space Agency and the Japan Aerospace Exploration Agency will image more of the planet’s surface than MESSENGER did and at a consistently higher spatial resolution.
Bickel and other Mercury scientists expect that BepiColombo will image more slope lineae across the planet, including smaller lineae, dimmer lineae, and lineae at southern latitudes. It will likely reimage some lineae-dense locations and reveal whether the streaks have changed in the 16 years since MESSENGER’s last images. And it may even capture repeat snapshots of a few locations, allowing scientists to see whether lineae change on short timescales.
“BepiColombo will image the whole surface at a resolution that would enable us to see most slope lineae,” Conway said. “We’ll get a complete picture of their spatial distribution, which will enable us to better test the volatile-driven hypothesis.”
—Kimberly M. S. Cartier (@astrokimcartier.bsky.social), Staff Writer
Citation: Cartier, K. M. S. (2026), Oozing gas could be making stripes in Mercury’s craters, Eos, 107, https://doi.org/10.1029/2026EO260052. Published on 12 February 2026.
Text © 2026. AGU. CC BY-NC-ND 3.0
Except where otherwise noted, images are subject to copyright. Any reuse without express permission from the copyright owner is prohibited.